Economics & Data Culture

The economics of everything you didn't question.

An independent blog unpacking behavioral economics, market anomalies, and the hidden incentives shaping everyday life — one chart, one counterintuitive finding at a time.

Supply and demand curves forming an abstract letter F
By the Numbers
2.25×losses hurt more than gains feel good $0the most expensive price ~80%stay on the default option +250%airport water markup 1970the year "lemons" explained markets $200the anchor that makes $99 look cheap 2.25×losses hurt more than gains feel good $0the most expensive price ~80%stay on the default option +250%airport water markup 1970the year "lemons" explained markets $200the anchor that makes $99 look cheap
Featured Analysis

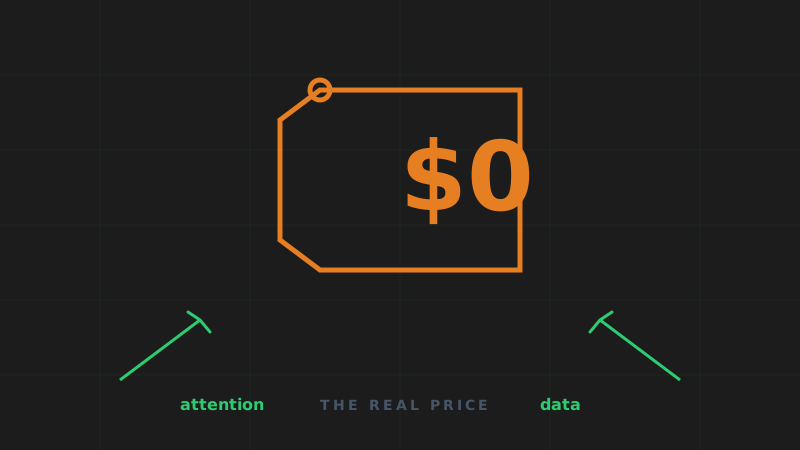
The story behind the price tag

Why does "free" cost so much? Our lead investigation traces the hidden economics of zero — and what we give up every time we pay nothing.

Explore by Topic

Six lenses on the economic world

Every article maps to one of six recurring themes — from the quirks of human behavior to the cold math of market structure.

Data Visualizations

The charts behind the claims

Every FreakOnomics article is built on a finding you can see. Here are four visualizations that anchor our reporting.

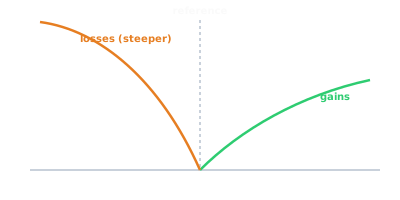
Loss Aversion Asymmetry

The prospect-theory value function: losses bite roughly 2.25× harder than equivalent gains please.

Loss aversion curve showing losses steeper than gains

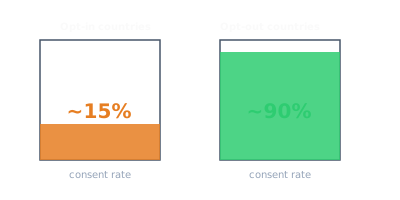
Defaults Are Decisions

Organ donation consent rates under opt-in (~15%) vs. opt-out (~90%) systems — the same choice, different default.

Bar chart comparing opt-in and opt-out organ donation consent rates

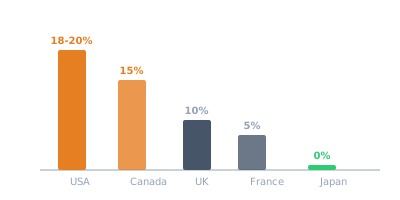
The Global Tipping Map

Tipping norms vary from 0% (Japan) to 18-20% (USA) — a social tax with no corresponding service logic.

Bar chart of tipping percentages across countries

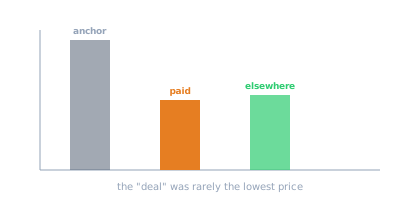
The Anchoring Discount

A $200 "original price" makes $99 feel like a steal — even when the same item sells for $92 elsewhere.

Bar chart showing anchor price versus actual paid price versus competitor price
Latest Analysis

Recent investigations

Twelve deep dives into the economic logic hiding in plain sight. Start anywhere — each stands alone.

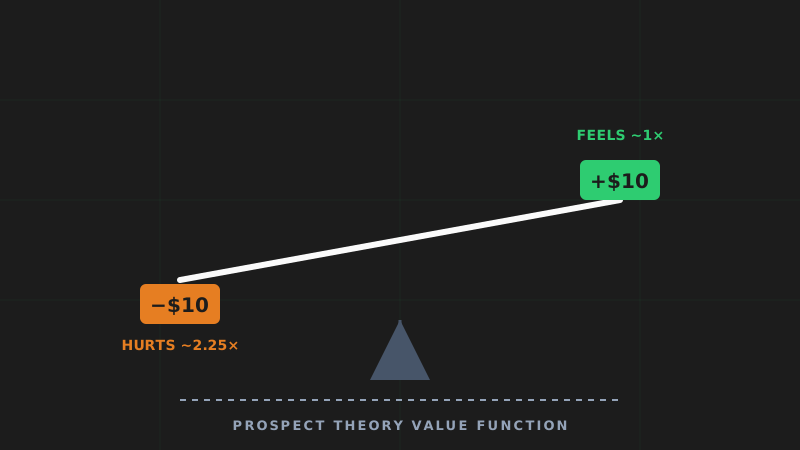
Loss aversion illustration
Behavioral Economics

Loss Aversion: Why Losing $10 Hurts More Than Finding $10 Feels Good

The asymmetry between gain and loss is one of the best-documented findings in behavioral science — and it explains everything from insurance to stock-trading.

8 min read
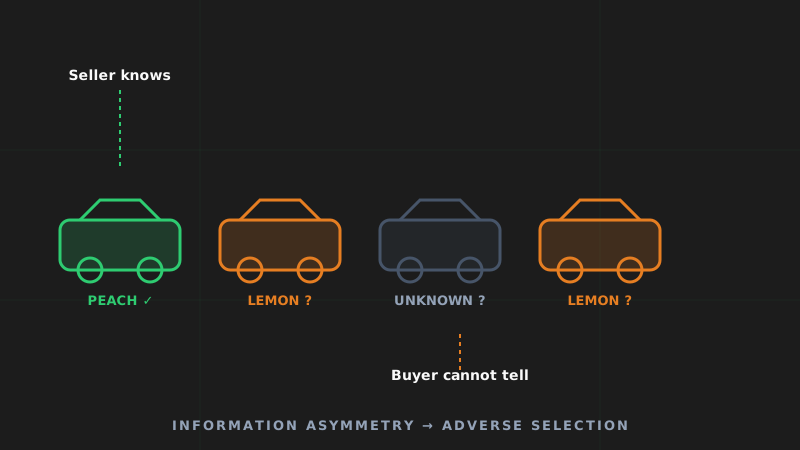
Market for lemons illustration
Market Analysis

The Market for Lemons: Why Used Car Economics Explains Everything

Akerlof's 1970 paper showed how information asymmetry can collapse a market — and the logic applies to dating, hiring, and insurance.

9 min read
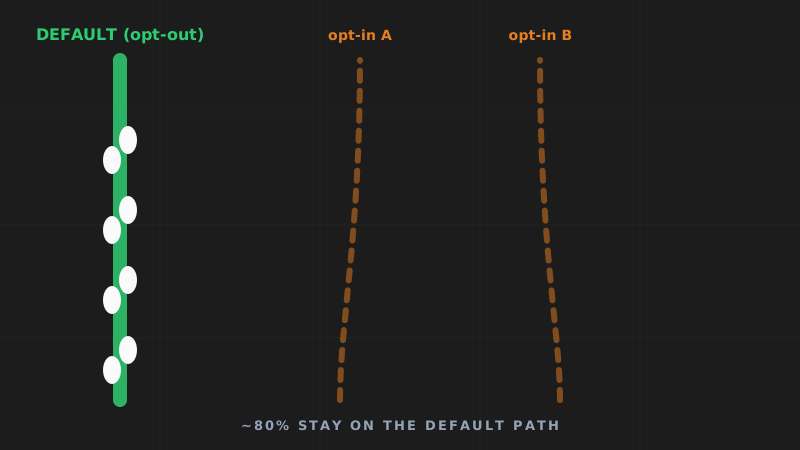
Nudge theory illustration
Economic Policy

Nudge Theory in Practice: How Defaults Change Behavior

The single most powerful lever in choice architecture is the option you don't have to choose. Here's what the evidence says about opt-out design.

7 min read
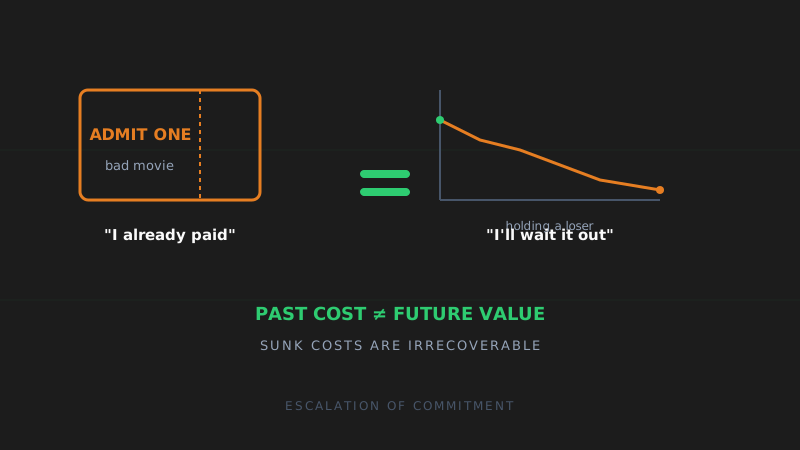
Sunk cost fallacy illustration
Decision Making

The Sunk Cost Fallacy: Why Bad Movies and Bad Investments Have the Same Problem

The money is gone. The only question is what to do next. Yet we routinely let irrecoverable costs dictate recoverable decisions.

8 min read
Captive markets illustration
Everyday Economics

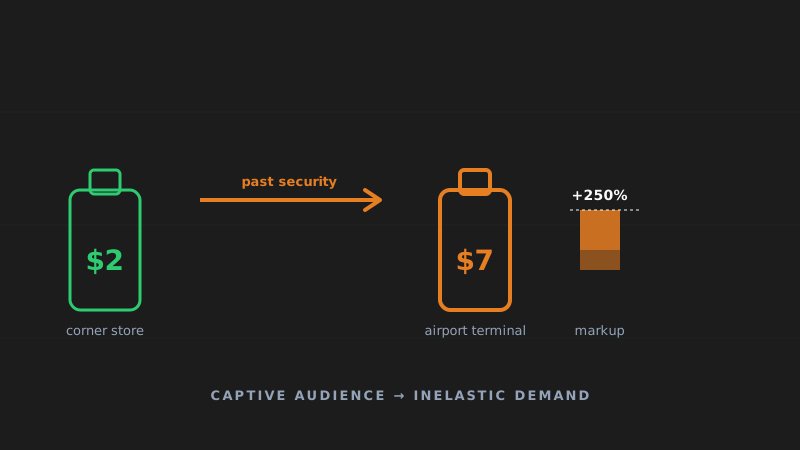
Why Airports Sell Overpriced Water: The Economics of Captive Markets

A 250% markup isn't greed — it's geometry. When the exits are controlled, demand becomes inelastic and price follows.

7 min read
Game theory traffic illustration
Decision Making

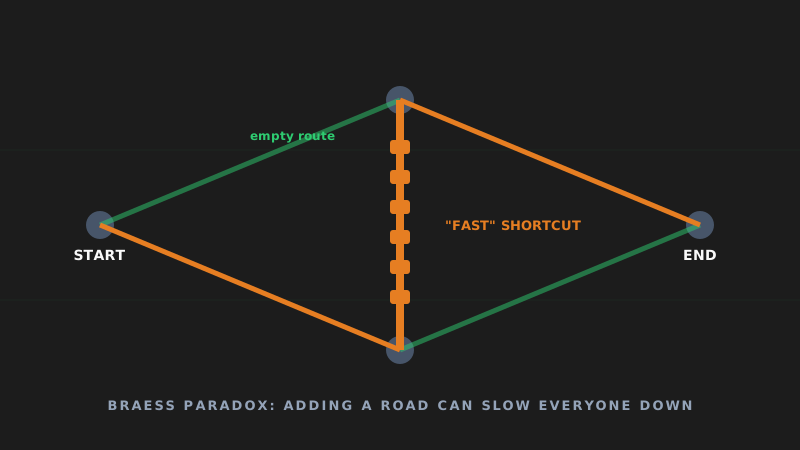
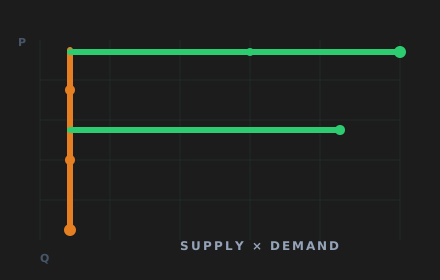
Game Theory and Traffic: Why Everyone Taking the Fast Route Makes Everyone Slower

The Braess paradox: adding a road can increase travel time for everyone. The math of selfish routing has a counterintuitive bottom line.

9 min read
Winner's curse illustration
Market Analysis

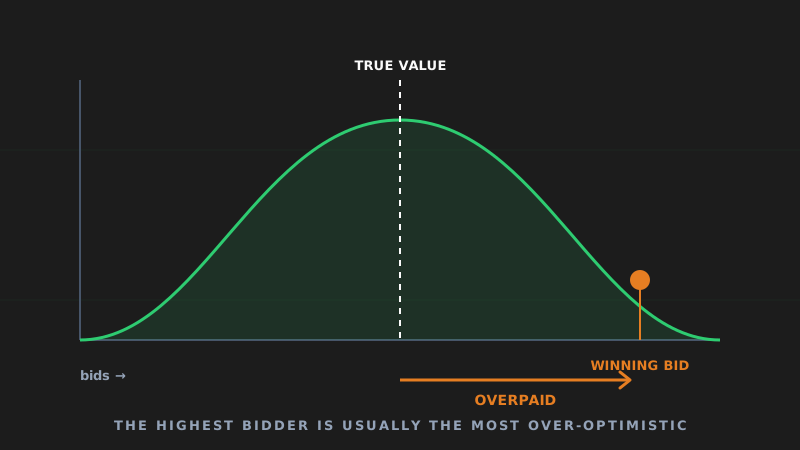
The Winner's Curse: Why Winning an Auction Can Mean Losing Money

In a common-value auction, the highest bidder is usually the one who overestimated the most. Winning is the warning sign.

8 min read
Tipping illustration
Everyday Economics

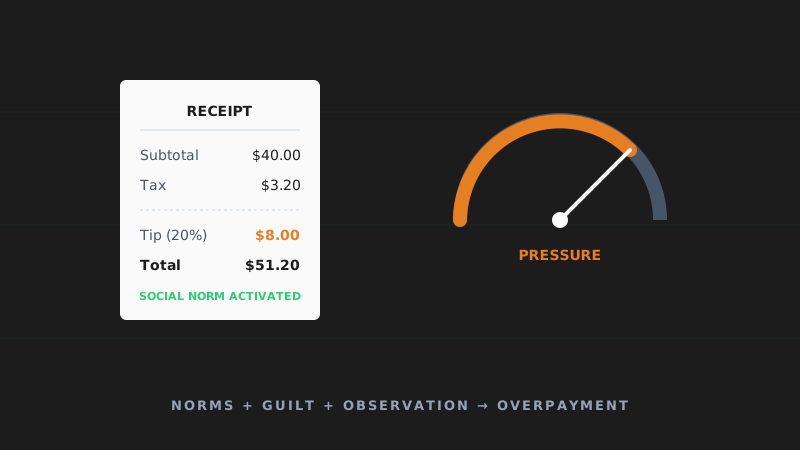
Behavioral Economics of Tipping: Why We Pay More Than We Should

Tipping is a tax on guilt and observation. The question isn't whether to tip — it's why the system is designed to make you feel bad if you don't.

7 min read
Buffet economics illustration
Everyday Economics

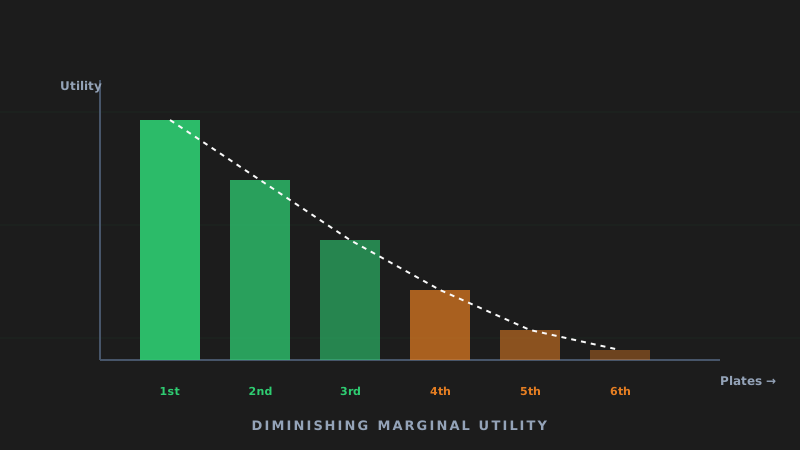
The Economics of All-You-Can-Eat Buffets

The buffet is a fixed-price gamble where the house wins on volume and the customer chases diminishing marginal utility.

8 min read
Black Friday illustration
Everyday Economics

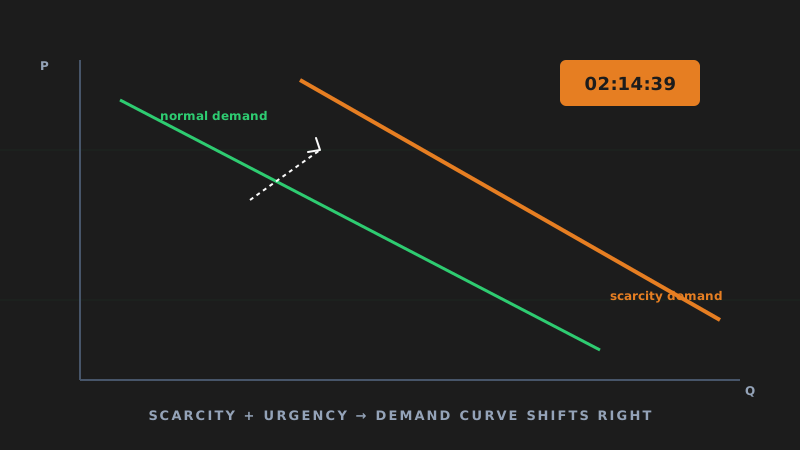
Why Black Friday Exists: The Economics of Scarcity and Urgency

Limited time. Limited stock. The demand curve shifts right when scarcity is staged — and the "deal" is rarely the lowest price.

8 min read
Anchoring effect illustration
Behavioral Economics

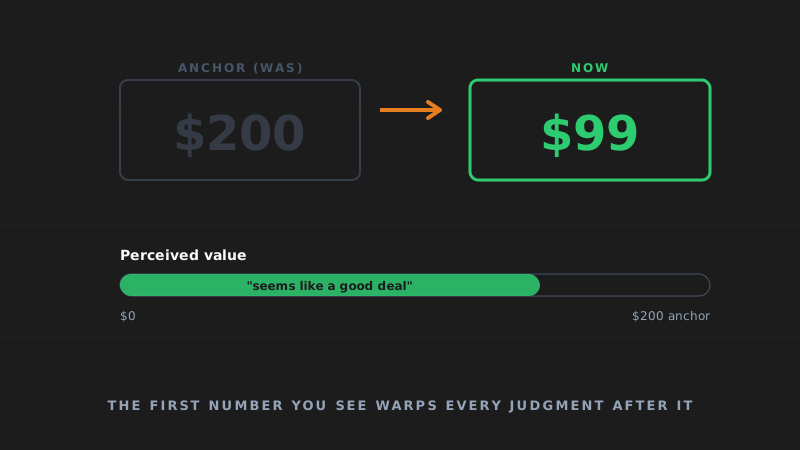
Anchoring Effect: Why the Original Price Always Seems Reasonable

The first number you see warps every judgment after it. Anchoring is why "was/now" pricing works — and why it's almost impossible to un-see.

7 min read
Economics of free illustration
Behavioral Economics

The Economics of Free: Why Zero Is the Most Expensive Price

When the price is zero, the cost is hidden. "Free" is the most effective demand-multiplier ever invented — and you are usually what's being sold.

9 min read
The FreakOnomics Brief

One chart. One counterintuitive idea. Every other week.

No filler, no hot takes. Just one economic concept, one dataset, and one thing you'll start noticing in the wild.

Free. Unsubscribe anytime. We never sell your data — that's the point.